Investing in a Fund?
I had some money that needed to grow, I didn’t want it to get eaten away by inflation. Do I put it in a tax free wrapper (an ISA in the UK), a high interest savings account. What should I do?
In a pension review I recently had, a figure of three percent was suggested as a requirement to maintain the value. I was getting just over 5% a year in a small AVC pension I had (which was invested in a fund). I had never actively invested in a fund before, so I decided to have a look.
I discovered there is a huge range of funds out there, all wanting you to invest your hard earned cash. But how do you decide which one to use?
My small AVC pension was with the company Aviva, so I started to look at their list of funds. There were way too many to choose from, so I decided to download the complete list of funds on a spreadsheet. All 1,357 of them.
Now what do I do with this huge list?
I opened the spreadsheet and used some filters, so I could narrow down the list of results.
Please note:
I am not a financial advisor. This website does not provide any financial advice or recommendations to buy or sell any investments, nor does it recommend any supplier of services. Please ensure you do your own research, or ask a regulated financial advisor before making any investment decisions.
Topics:
I’ve Downloaded a List of Funds, What do I Look for, What do I do with the List?

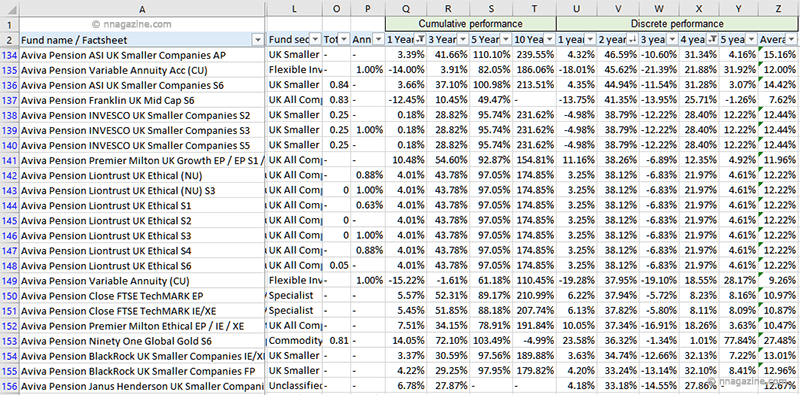
When you download a large list of funds, it can all look very daunting. What we need to do, is to make life a whole lot easier, by breaking down the list into smaller chunks. We can do this by filtering the spreadsheet.
First we need to find out what we need to filter…
I Have a Spreadsheet List of Funds, What Does Each Heading Mean?
The list of funds I downloaded had the following key headings:
- Risk Ratings:
- Discrete Performance Average: (See ‘I added my own columns…‘ below).
- Discrete Performance:
- Fund Risk Warnings:
- Charges:
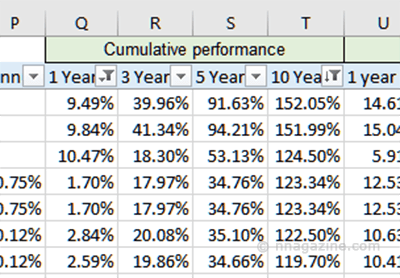
- Cumulative Performance:
This list is in the order I have used for filtering the spreadsheet, (for my own personal use, and not necessarily in any order of importance)…
I added my own additional columns to help filter the list of 1,357 different funds.
Risk Ratings:
Anything to do with investments have a similar standard phrase…
The value of investments may go up or down. Dividend payments can fall as well as rise. Any information relating the to past performance of an investment, or investment service is not a guide to future performance. You may not get back the original amount invested. You should not invest any money you cannot afford to lose.
No-one wants to think it, but very wise words…
The key thing here, is not to be greedy and go for the biggest returns, but to decide what level of risk you want to take? There are loads of ‘risk calculators’ out there, so do a Google financial risk calculator search. But don’t get sucked in to anyone trying to sell you something. Choose one from a reputable site, or from a financial organisation you know. As I was looking at Aviva, here’s a link to theirs…
Once you have decided on the risk rating(s) you want to use, you can use this rating to filter your spreadsheet. I used the risk ratings 3, 4 and 5 to compare the percentage returns (historical) against each other. I.e. there may be a fund with a lower risk rating, with a better return (historical) than a fund with a higher risk.
Note:
How I keep using the term historical. It’s all too easy to forget the figures shown are historical, and are no indication of what you may get back in the future? We can only hope…
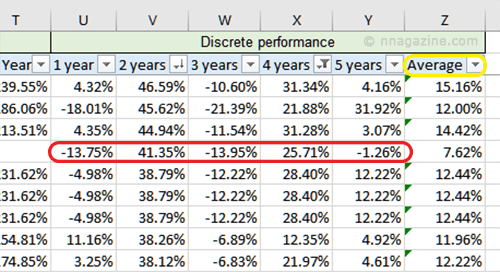
Discrete Performance:
Discrete performance shows the performance for each year. I.e. Year one, two, three, five and ten. The importance here, is that you can see if the fund is consistently performing. I.e. The fund has historically consistently performed every year, rather than one good year (three years ago) and a poor performance the rest of the time…
This is where a new column for ‘Average Discrete Performance’ comes in.
The Discrete Performance Average:
If you’re creating a new column in excel to measure the average discrete performance, you need the following formula in an adjoining cell, (and then copy it down the column to the last entry).
=AVERAGE(U1:Y1)
Amend the formula cell references to suit your own spreadsheet.
This will give you the average of the discrete performance. You can then use this average to compare each year measured to see if there is consistent historical performance.

Fund Risk Warnings:
There are various places a fund can invest money. Some of the main ones are:
- Fixed Interest (corporate and government bonds, gilts).
- Money Markets.
- Property.
- Shares.
Each investment area has its risks, so it’s worth noting what they are. You may have a particular area of investing that you don’t want to take a risk with or be a part of. Again, there are loads of ‘fund risk warnings’ out there, so do a Google fund risk warnings search. But don’t get sucked in to anyone trying to sell you something. Choose one from a reputable site, or from a financial organisation you know. As I was looking at Aviva, here’s a link to theirs…
Once the spreadsheet has been filtered to narrow down which funds you may be interested in, you can check the risk warnings to see if you’re happy with them.
Charges:
Beware of charges. They can soon add up, and appear amplified if your fund doesn’t do so well…
Bear in mind there may be two sets of charges, the fund managers charges and investment platform charges.
An example list:
- Fund manager expense charge (FMEC).
- Total additional yearly charge.
- Annual charge (investment platform).
- Extra management charge, or additional yearly charge (investment platform)?
Other possible charges:
- A fee for setting up (front end).
- A fee for selling or closing (back end).
Each fund provider may have a different set of fees.
- The same fund (or type of fund) may be offered to you by different investment platforms.
- Check the small print for any differences in their operating charges (expense ratios) that may be applied.
- Read the small print and be aware of what you may be charged?
Take note of how you are charged..?
- If you are charged a 1% management fee for your $1000 fund.
- That would cost you $10.
- However, if you get a 5% return ($50) then you are left with $50 – $10 = $40.
You have actually lost 20% of your profit.
Cumulative Performance:
It’s nice to see the year on year cumulative performance of what you might get. But don’t get suckerred in! These are historical results, not necessarily what your gonna get when you put your hard earned cash upfront!

Funds I may be interested in (so I can find them again):
I created an additional spreadsheet column (call it whatever you want), so I could mark which funds may be of interest, so I could easily find them again, (if I re-sorted the spreadsheet).
Index Funds (or Index Tracker Funds, ETF’s)
An index fund, index tracker fund, or an exchange traded fund (ETF) is a portfolio of stocks or bonds designed to follow the performance of a financial market index.
They can be one of the simplest ways to invest. There’s no manager or analysts fees to pay, so are often a low cost option. However, platform charges may apply (the investment company charges), or they may be actively managed (where additional fees may apply).
An example of an index fund is Standard & Poor’s 500 Index (S&P 500). Here is a list of most of the stock market indices.
The fund may be offered to you by different investment platforms, so you need to check the small print for any differences in operating charges (expense ratios) that may be applied.
How do I Identify an Index Fund?
The simple answer is to do a search for index funds and read the details…
Noting:
- Not all index tracker funds are the same. Some will only try to mimic an index, rather than follow it.
- You need to check how close the fund follows the actual index.
- Look at where the money is invested.
- Read the small print.
On the spreadsheet list of funds, an index tracker fund should show no charges, (other than the ongoing platform charges).
Investment Funds – The Small Print?
It’s all too easy to randomly pick a fund that looks good. The one with the biggest historical return. But how do you know it’s going to do the same in the future?
You don’t. So you need to read the small print.
- Read the funds factsheet (usually downloaded from the investment platform website).
- Compare factsheets with other funds and from different sources (if available).
Look at the: (Links open in a new tab)
- Funds size?
- How long has the fund been going?
- Risk rating?
- Risk warnings?
- Discrete annual performance?
- Cumulative annual performance?
- Asset allocation?
- Holdings?
- Credit quality?
- Geographical spread?
Don’t Take a Glossy Pamphlet or Fact Sheet at Face Value.
- Do a Google search on the fund. See what others say?
- Use an online portfolio tool to review funds. Some popular ones are:
In no particular order (Links to tools in brackets ) – Links open in a new tab.
- Trustnet. (Global)
- Morningstar. (UK, Global)
- Personal Capital. (Global)
- Yahoo Finance. (UK, Global)
Note:
I’ve tried to pick free tools, but some may have additional plans for extra tools, and fluffy stuff, etc.
Hope this helps… ![]()

